Skip to content
  EN
EN  DE
DE  العربية

Summary: Imagine that a critical production facility breaks down. The consequences? Production downtime, disappointed customers, and significant financial losses. This is where fault tree analysis comes into play: an effective method that helps you, as an operations manager, maintenance manager, or quality manager, to understand, predict, and avoid such scenarios. The method makes it possible to prevent system failures before they even occur by identifying all possible causes of failure. Logical links between individual events make it possible to understand how different factors interact and lead to total failure. The ability to calculate the probability of failure and quantify risks is particularly valuable.
What Is Fault Tree Analysis (FTA)?
Fault tree analysis (FTA) is a systematic, deductive method for identifying and evaluating critical sources of failure in complex systems. FTA takes a defined, undesirable event (e.g., machine failure or production error) as its starting point and works backwards from there. The problem is systematically broken down into its components until the root causes are identified.
This results in a tree-like structure that shows all possible combinations of input events that can lead to the main problem. The method uses Boolean logic and graphical representations to visualize and quantify the relationships between fault causes and their effects. Fault tree analysis helps determine the cause of failure or test the reliability of a system by stepping through a series of events logically.
Historical Background
The technology was developed in the 1960s at Bell Laboratories for space travel and has since become established in industry. FTA is mainly used in safety-critical sectors, including aviation, nuclear technology, chemicals, and the process industry.
How do you turn complex fault trees into clear actions?
EQMS Software guides you efficiently through every step of fault tree analysis.
Fault Tree Diagram
A fault tree diagram is a graphical representation of fault tree analysis. It uses a tree structure to show how various events and causes can lead to an undesirable main event.
The diagram begins at the top with the so-called top event (e.g., a system failure or a deviation in product quality) and branches down to all possible causes. The individual elements are connected to each other by logical links. The most common are:
- 🔴 AND gate: All events must occur simultaneously.
🔴 OR gate: Just one event is enough to trigger the higher-level event.
The tree structure ends with the so-called basic events, the fundamental causes of errors that cannot be broken down further. The hierarchical representation shows which combinations of events are critical and where the weak points in the system lie.
➤ The diagram serves both as a visual communication tool and as a basis for quantitative calculations of failure probabilities.

Areas of Application for Fault Tree Analysis
Fault tree analysis (FTA) is applied wherever a system-wide view of failure risks, interactions, and logical fault relationships is required.
Product development and design
FTA supports the validation of safety-critical functions at an early stage and helps identify potential failure paths before products or systems are released.
Safety analyses of technical systems
Complex technical systems can be analyzed in a structured way to understand how individual failures combine to create hazardous system states.
Quality and reliability management
Fault tree analysis provides a logical framework for identifying reliability weaknesses and prioritizing improvement actions based on their impact.
Risk assessments in critical infrastructures
In safety- and availability-critical environments, FTA helps assess systemic risks and supports defensible decision-making.
Maintenance and fault analysis
FTA enables systematic fault cause determination, supports maintenance planning, and improves the handling of recurring failures.
Root cause analysis
Deviations, complaints, and near misses can be analyzed logically to identify underlying causes rather than treating symptoms.
➤ The overall objective is to make critical fault paths transparent, establish priorities on a sound analytical basis, and derive targeted technical, organizational, or maintenance- related measures.
How does an FTA work?
Now let’s get specific. How do you actually build a fault tree? The process follows a clear structure that has proven itself in every industry.
Step 1: Define the top event
This is often where the success or failure of your analysis is decided. Your top event must be specific enough to deliver usable results, but broad enough to cover all relevant causes.
“Machine not working” is too vague. Better would be: “Milling machine type XY stops unexpectedly during operation.” The more precise you are here, the more useful your fault tree will be.
Step 2: Identify the direct causes
Ask yourself: What must happen immediately before the top event for it to occur? This is not yet about the root causes, but about the direct level below them.
In our milling machine example, these could be: overheating, power failure, mechanical defect, or software error. You then connect these events to the top event using the appropriate logic gate.
Step 3: Work your way down systematically
Now take each of these events and ask yourself again: What could cause this? Repeat this process until you arrive at basic events that cannot be broken down any further.
It is important to remain consistent. Treat each branch of your tree with the same care. Often, the critical weak point is hidden where you least expect it.
Step 4: Review the logic
Critically review your completed tree. Are the logical connections correct? Have you included all relevant paths? Critically review your completed tree. Are the logical connections correct? Have you included all relevant paths? It is beneficial to involve colleagues who can contribute different perspectives to the qualitative analysis.
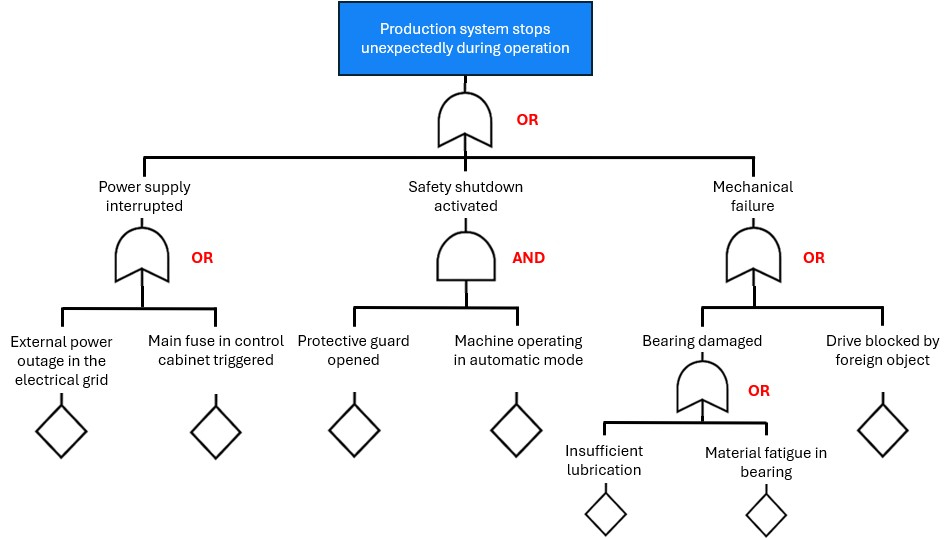
Practical example: Fault Tree for an Unexpected Machine Stoppage
The following illustration translates the four steps directly into a simple fault tree. The top event is the unexpected stoppage of a milling machine. Below this, you can see the direct causes and the breakdown down to the basic events.
Quantitative Fault Tree Analysis
A qualitative fault tree shows the structure of possible faults. However, probabilities are required to support informed decision-making.
Each basic event is assigned a probability of occurrence, typically derived from:
- Historical data
- Manufacturer specifications
- Empirical values
Mathematical methods are then used to calculate the probability of the top event. Assuming statistical independence between basic events, the following rules apply:
- With an AND gate, probabilities are multiplied.
- With an OR gate, probabilities are added while subtracting the intersection to avoid double counting.
In practical applications, dependencies or common cause failures may require additional modeling beyond these simplified calculations.
Example Calculation
Imagine two independent basic events connected via an AND gate:
- Event A occurs with a probability of 5% (0.05).
- Event B occurs with a probability of 10% (0.10).
The probability of both occurring simultaneously is:
0.05 × 0.10 = 0.005 (0.5%)
With an OR gate, the combined probability is calculated as:
0.05 + 0.10 − (0.05 × 0.10) = 0.145 (14.5%)
➤ As the fault tree expands, these calculations become increasingly complex. For rare events with very small probabilities, simplified approximations are sometimes used. In larger systems, specialized software tools automate these calculations and provide additional insights such as minimal cut sets, importance measures, and sensitivity analyses.
Differences between FTA and FMEA
Fault tree analysis and FMEA take fundamentally different approaches: While FTA starts with a specific fault and searches backwards for the causes, FMEA works forwards: it systematically examines components and processes for possible faults before they occur.
FTA focuses on a specific problem, such as the failure of a pump. The analysis breaks down this event step by step to identify the root causes. FMEA, on the other hand, looks at every component and every process step and asks: What could go wrong here? What impact would that have? How likely is it?
Another difference lies in quantification: FTA calculates specific failure probabilities using logical links, which is particularly helpful when evaluating safety-critical scenarios. FMEA works with risk priority numbers that combine probability of occurrence, significance, and probability of detection.
In practice, both methods complement each other. FMEA is particularly suitable for preventive error avoidance in the development phase. FTA is used when analyzing known critical events or investigating failures that have already occurred.
| Criterion | FTA (Fault Tree Analysis) | FMEA (Failure Mode and Effects Analysis) |
|---|---|---|
| Approach | Top-down (starting from a defined undesired event) | Bottom-up (starting from potential failure modes) |
| Objective | Root cause analysis of a specific top event | Systematic identification of all potential failure modes |
| Representation | Logical tree structure using Boolean logic | Structured tables and lists |
| Level of Detail | Highly effective for system-level failure chains | Highly effective for individual components and processes |
| Quantification | Can be qualitative or quantitative (probabilistic) | Typically qualitative or semi-quantitative using Risk Priority Numbers (RPN) |
| Failure Identification Logic | Deductive | Inductive |
| Primary Focus | Identification of root causes and their logical relationships | Identification and assessment of potential failure causes and effects |
| Typical Application | Primarily used in safety-critical industries (e.g. aerospace, automotive, nuclear) | Commonly applied in product development and process design |
| Outcome | Fault tree diagram illustrating causal relationships leading to the top event | Structured table with Risk Priority Numbers (RPN) for failure prioritization |
| Risk Assessment | Combination of event probabilities along fault tree paths | Risk Priority Number (RPN) based on severity, occurrence, and detection |
| Example | Analysis of aircraft system failures where multiple causes may lead to an accident | Analysis of design or process failures in product development to identify weaknesses |
| Strength | Provides clear visualization of causal relationships and dependencies | Enables effective prioritization of risks to focus resources on critical issues |
| Limitations | Can become highly complex and difficult to interpret for large systems | May generate a large number of potential failure modes in complex systems |
➤ In practice, both methods complement each other. FMEA is particularly suitable during the development phase for preventive risk mitigation, while FTA is applied to analyze known critical events or investigate failures that have already occurred.
Get our free FMEA-Matrix Template (PDF) here
What Mistakes Should You Avoid When Modeling Fault Trees?
❌ Incomplete error identification
Not all relevant operating conditions are taken into account. Start-up processes, maintenance work, or partial load operation are often missing from the analysis.
❌ Untested assumptions
System behavior is defined without comparison with manufacturer data, operating experience, or technical specifications, which leads to inaccurate assumptions.
❌ Missing interactions
Dependencies between components, such as shared power supplies or control systems, are often not considered.
❌ Inaccurate failure probabilities
Probabilities of occurrence are not based on reliable sources such as field data, standard reference values, or manufacturer specifications.
❌ Incorrect level of detail
The fault tree is either overly complex and difficult to interpret or overly simplified, causing critical sources of error to be overlooked.
❌ Neglect of rare faults
Events with a low probability of occurrence but high damage potential, such as lightning strikes or corrosion, are frequently ignored.
❌ Lack of expert validation
The analysis is not sufficiently reviewed by specialists from operations, maintenance, or safety engineering.
❌ Incorrect logic links
AND and OR gates are not applied according to the actual failure logic, which can lead to incorrect or misleading results.
❌ Inadequate documentation
Missing versioning, unclear definitions, and incomplete evidence compromise traceability and reproducibility.
❌ Lack of consequence assessment
The impact of failures on safety, availability, environmental protection, and economic performance is not adequately evaluated.
❌ Top event too broad without clear boundaries
The top event is defined too generically and cannot be clearly distinguished from other failure causes.
❌ Neglect of external influencing factors
External influences such as environmental conditions or interactions with other systems are excluded from the analysis.
❌ No regular validation of the analysis
The fault tree is not reviewed or updated regularly to reflect operational changes or new findings.
Integrating Fault Tree Analysis into Risk Management
Fault tree analysis should not be an isolated tool that you only use occasionally. It is most effective as an integral part of your comprehensive risk management strategy.
Use FTA systematically to analyze potential critical events in new plants or processes at an early stage. By systematically tracing possible causes, weak points can be identified before they occur in operation. The insights gained can then be used to plan technical protective measures and reduce risks.
FTA also proves valuable for recurring audits and reviews. Systems and processes are constantly changing, new risks arise, old ones disappear. Update fault trees regularly and they will remain an up-to-date and practical tool.
Link your FTA results to specific measures. Once you have identified critical paths, define appropriate monitoring strategies, preventive maintenance intervals, or additional safety precautions. Document these decisions and their rationale.
Digital Tools for Creating Fault Trees
The manual creation of fault tree analyses leads to considerable problems in complex systems. Probability calculations are prone to errors, the identification of critical paths is time-consuming, and updating the analysis when system changes occur ties up a disproportionate amount of resources. In addition, fault trees must be clearly documented, versioned, and verifiably proven in audits.
Digital tools provide support at various levels. Specialized FTA software offers graphical editors and automated calculations of minimum cut sets and system reliability. For companies that use fault tree analyses in the context of standardized quality processes, integration into quality management systems is recommended.
Solutions such as flowdit enable the structured documentation of risk analyses, link fault trees with corrective measures and audit processes, and ensure end-to-end traceability.
The choice depends on the intended use: dedicated FTA tools for in-depth probabilistic analyses, QMS solutions for systematic embedding in existing quality processes.
From Analysis to Implementation: flowdit as a QMS Solution
Are you familiar with this problem? You have invested significant time in creating fault trees, identifying root causes, and calculating probabilities. Yet the insights gained often remain locked away in static documents, are not transferred during shift handovers, and when recurring failures occur, the analysis starts from scratch once again.
The real challenge is not the analysis itself, but ensuring that the knowledge generated is permanently available and consistently translated into concrete improvement measures.
flowdit closes this gap between analysis and operational implementation. The app for quality management and risk analysis systematically documents fault tree analyses and intelligently links them with fault reports, maintenance histories, and quality-related data. When an issue occurs, relevant fault paths and previously implemented solutions are immediately visible. New insights can be seamlessly integrated into existing FTA structures.
Try flowdit free for 30 days or download our FMEA template to experience how structured risk analysis becomes actionable across daily operations.
FAQ | Failor Tree Analysis
What is fault tree analysis (FTA) and what is it used for?
Fault tree analysis (FTA) is a systematic method for identifying the causes of faults in complex systems. It visualizes possible faults and their causes in a tree diagram and shows their interactions. The method is mainly used for risk assessment, safety enhancement, and early detection of faults, and is applied in development, production, and maintenance management.
What is required for a fault tree analysis (FTA)?
A fault tree analysis (FTA) first requires an failure mode and effects analysis FMEA that has systematically identified all relevant types of faults. The FTA itself requires a clearly defined top event and knowledge of the logical links (AND/OR relationships) between the component failures that can lead to this event. For a quantitative FTA, failure rates or MTBF values of the components under consideration are also required in order to calculate the probabilities of critical fault paths occurring.
What are the benefits of fault tree analysis?
Clear visualization of how failures lead to a critical event
Strong support for root cause analysis
Better prioritization of risk reduction measures
Improved understanding of complex systems
Effective communication of risks and dependencies
What does “top event” mean in fault tree analysis and how is it selected?
The “top event” in fault tree analysis is the most important fault or main problem being investigated. It is selected based on the greatest risk or most serious impact. The selection is made by assessing the potential hazards and their effects.
What are basic events or fundamental faults in a fault tree analysis?
Basic events, also known as fundamental faults, are the smallest, indivisible faults or events in a fault tree analysis. They represent the starting points for the analysis and are usually simple, immediately recognizable causes of faults, such as a system failure or a defective component.
What logical gates (AND/OR) are there in a fault tree and how do they work?
AND gate: A fault only occurs if all input fault messages are true. It links events that must occur together to cause a failure (e.g., both components must fail for the fault to occur).
OR gate: An error occurs if at least one of the input error messages is true. It shows alternative paths to the top event (e.g., the failure of one of several components is sufficient to affect the system).
➤ Gates help to model the complex interactions between different causes of errors.
How do you identify the critical paths in the fault tree?
The critical paths in the fault tree are identified by tracing the possible combinations of basic events that lead to the top event. This involves analyzing which fault events and combinations contribute most to the probability of the top event. Critical paths are those connections in the tree where even small changes have the greatest impact on the overall risk. Tools such as minimal cut set analysis help to isolate these paths and evaluate them in a targeted manner.
What is the difference between qualitative and quantitative fault tree analysis?
A qualitative FTA identifies potential failures and their causes without calculating probabilities, and assesses the severity of the risk.
A quantitative FTA calculates probabilities for the occurrence of failures and the frequency of events in order to quantify more precise risks and their effects.
What data is required for the quantitative assessment of failure probabilities?
For the quantitative assessment, data on the probabilities of occurrence of the basic events, historical failure rates, and relevant operating data are required. These values are derived from empirical values, system documentation, or similar systems.
What are minimal cut sets (MCS) and how are they interpreted in fault trees?
Minimal cut sets (MCS) are the smallest combinations of basic events whose joint occurrence leads to the top event. They show the most critical fault combinations that cause the system to fail. In fault tree analysis, MCS are used to calculate the probability of a system failure by combining the probabilities of the basic events in the MCS. The fewer events there are in an MCS, the more likely a system failure is to occur.
In which cases is an FTA more suitable than a root cause analysis (RCA)?
FTA is more suitable for identifying potential errors at an early stage and systematically assessing risks. RCA, on the other hand, is used to analyze and remedy the causes of errors that have already occurred.
How can fault tree analysis be combined with Six Sigma or 8D reporting?
Fault tree analysis (FTA) can be combined with Six Sigma and 8D reporting by serving as a tool for root cause analysis and risk assessment.
In Six Sigma, FTA helps identify and quantify critical sources of error to support the DMAIC process. In 8D reporting, FTA is used in root cause analysis to systematically identify the roots of errors and develop targeted corrective measures.
What are the similarities and differences between fault tree analysis and HAZOP?
Both FTA and HAZOP identify risks, but FTA systematically analyzes the causes of faults and their effects on a top event. HAZOP, on the other hand, uses specific questions to examine deviations in operating conditions and potential hazards. FTA is often used preventively, while HAZOP is more commonly used for existing systems.
How can fault tree models be integrated into checklist software or audit dashboards?
Fault tree models can be integrated into checklist software by incorporating fault causes and their effects into the checklists as structured questions or steps. Each potential fault cause is represented as a checklist item, with users assessing the probability of occurrence and severity. This integrates fault trees directly into the audit process to systematically identify and document risks.
Image: Adobe Stock – Copyright: © sulit.photos – stock.adobe.com