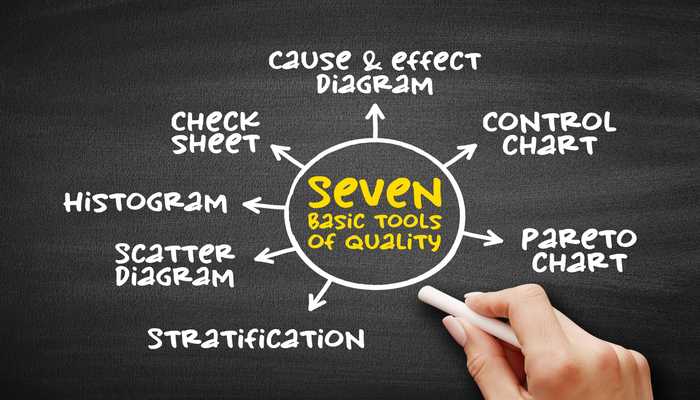
Summary: In the fast-paced manufacturing industry, identifying the root causes of problems is crucial for ensuring quality control and process improvement. One effective method used for root cause analysis is the Ishikawa diagram, also known as the fishbone diagram. Developed by Kaoru Ishikawa, a renowned Japanese quality control expert. The Ishikawa diagram visually represents the possible causes contributing to a specific event or problem and is considered one of the 7 basic quality tools in quality management.
What is an Ishikawa Diagram?
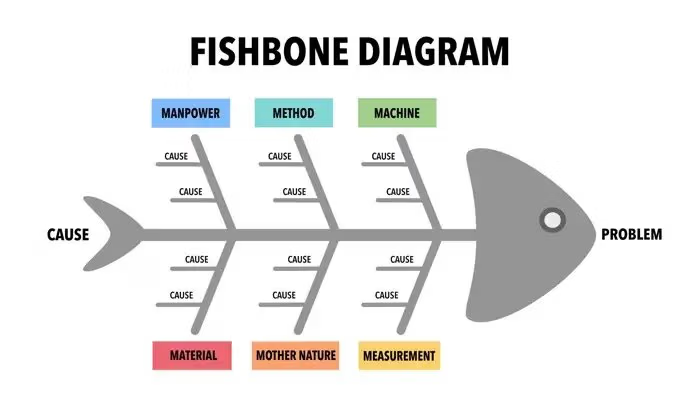
An Ishikawa diagram is also called a fishbone diagram. It resembles a fish skeleton. Kaoru Ishikawa created it. The diagram has a horizontal arrow from left to right. This arrow represents the problem or effect. Several slanted lines branch off the arrow. These lines look like fish bones. They represent different categories of causes. Common categories include manpower, methods, machinery, materials, measurements, and mother nature.
How to Make an Ishikawa Diagram?
To create an Ishikawa diagram, a team gathers to brainstorm. They identify potential causes of a specific problem. The problem statement is written on the right side. The team lists possible root causes. Each cause is written on a slanted line. These lines branch off from the main arrow. Each cause corresponds to its category. The process continues until all causes are linked to the problem. The result is a visual representation of the factors contributing to the problem.
Looking to streamline your quality management?
See how our EQMS can enhance your quality management processes
Types of Ishikawa Diagrams
The diagrams can be customized to suit different needs and objectives. Some common types of diagrams include:
1. Manufacturing Process Diagram:
This diagram outlines the steps involved in manufacturing and product development, helping to identify potential issues at each stage. It ensures that you define and implement the necessary resources and actions.
2. Quality Control Diagram
Used primarily in quality management, this type of Ishikawa diagram focuses on quality defects and prevention. By identifying potential factors causing an overall effect, such as product defects, the diagram aids in implementing corrective measures and preventing future quality issues.
3. Service Industry Diagram
Ishikawa diagrams, often linked with manufacturing, are also effective in the service industry. You can analyze service-related issues, like customer service delays or service delivery errors, by applying Ishikawa diagrams to identify root causes and implement improvements.
Common Uses of Ishikawa Diagrams
Manufacturers and product developers widely use the diagrams to outline process steps and identify potential factors causing an overall effect. Here are some common applications:
1. Quality Control
In quality management and defect prevention, we extensively use Ishikawa diagrams to identify potential factors that cause quality issues.
2. Problem Solving
When a problem arises, the diagrams help teams systematically analyze and identify the root causes of the problem.
3. Process Improvement
By visualizing the causes and their relationships, the diagrams assist in identifying process inefficiencies and areas for improvement.
4. Team Collaboration
The diagrams facilitate collaboration and brainstorming sessions, allowing team members to contribute their knowledge and insights.
Creating an Ishikawa Diagram
Here are the steps to create an effective diagrams:
1. Define the Problem
Clearly articulate the problem statement that you want to investigate using the Ishikawa diagram.
2. Draw the Fishbone
Draw a horizontal arrow running from left to right on a flipchart or whiteboard. This arrow represents the “backbone” of the fish.
3. Brainstorm Major Categories
Along the backbone, brainstorm the major categories of causes that could contribute to the problem.
4. Branching Off the Causes
From each major category, draw diagonal lines, resembling the fish’s bones, branching off the backbone.
5. Identify Potential Causes
Within each category, brainstorm and write down the potential causes of the problem.
6. Analyze Relationships
Analyze the relationships between different causes and determine how they might interact or contribute to the problem.
7. Refine and Prioritize
Refine the diagram, remove duplicate or irrelevant causes, and prioritize the most significant factors.
8. Continue to Ask “Why?”
For each potential cause, continue to ask “Why?” to dig deeper and identify the root causes behind them.
9. Determine Root Causes
Through analysis and discussion, identify the root causes that are most likely responsible for the problem.
Benefits and Applications of Ishikawa Diagrams
The primary purpose of the diagrams is to identify the root causes of problems or events. By visually representing the potential causes in different categories, the diagram provides a comprehensive overview that helps teams narrow down and focus on the factors requiring attention.
Facilitating Brainstorming Sessions
The diagrams are excellent tools for facilitating brainstorming sessions. By providing a structured framework for identifying causes, the diagram encourages team members to contribute their ideas and insights. The visual nature of the diagram also aids in stimulating creativity and critical thinking, as participants can see the cause-and-effect relationships between different factors.
Organizing Information
During the brainstorming session, teams use an Ishikawa diagram to organize and categorize the causes. They write each cause on the appropriate slanted line, representing a specific category. This method allows them to sort the information into distinct categories, making it easier to analyze and prioritize the causes based on their significance and impact.
Enhancing Communication and Collaboration
The diagrams promote effective communication and collaboration within teams. The visual representation of causes allows team members to quickly grasp the complexity of the problem and understand the various factors involved. It also helps teams communicate their findings and analysis to other stakeholders, such as management or clients, in a clear and concise manner.
Supporting Continuous Improvement
By identifying the root causes of problems, the diagrams contribute to the ongoing process of continuous improvement. Teams can identify the causes and then develop and implement targeted solutions to address them. Through a cycle of analysis, action, and evaluation, Ishikawa diagrams assist in driving positive change and ensuring long-term improvements.
Conclusion
In the realm of manufacturing and problem-solving, Ishikawa diagrams have emerged as a powerful and widely used tool for root cause analysis. Their ability to visually represent the causes of a specific event or problem, along with their versatility and ease of use, make them invaluable in identifying and addressing root causes. By leveraging Ishikawa diagrams, organizations can enhance their quality control processes, improve efficiency, and drive continuous improvement.
FAQ | Ishikawa Diagrams
What is the significance of the term "Ishikawa" in Ishikawa diagrams?
The term “Ishikawa” refers to Kaoru Ishikawa, the Japanese quality control expert who developed the Ishikawa diagram. He pioneered using causal diagrams to analyze and address the root causes of problems.
How does an Ishikawa diagram help in prioritizing causes?
After identifying potential causes, the diagram helps prioritize them based on their impact and likelihood, allowing teams to focus on the most critical issues first.
Are Ishikawa diagrams only used for problem-solving?
Ishikawa diagrams are commonly used for problem-solving and root cause analysis, but you can also utilize them proactively for process improvement. By identifying potential causes before problems occur, organizations can implement preventive measures and optimize their processes.
In what way can Ishikawa diagrams aid in quality control?
In what way can Ishikawa diagrams aid in quality control? The diagrams are extensively used as a quality management tool to identify and eliminate the root causes of defects, thus preventing recurring quality issues.
Are there any limitations to using the diagrams?
While the diagrams are highly useful, they do have some limitations. They rely on the knowledge and perspectives of the team members involved. So, incomplete or biased information can lead to inaccurate analysis.
Can Ishikawa diagrams be created electronically?
Yes, Ishikawa diagrams can be created electronically using various software tools. These tools offer pre-designed templates and enable easy collaboration, editing, and sharing of diagrams among team members, making the process more efficient and accessible.
How can the diagrams be tailored to different industries?
Ishikawa diagrams can be customized by adjusting the categories and focus areas to suit specific industry needs, whether in manufacturing, services, or other sectors.
How does CAPA integrate with the Ishikawa diagram?
The Ishikawa diagram, also known as the fishbone diagram, is used to identify potential causes of a problem. Once these causes are visualized through the diagram, CAPA is implemented to take corrective and preventive actions to resolve the issue and prevent future occurrences.
Image: Adobe Stock – Copyright: © Orapun – stock.adobe.com


